CLBR in IVF research
A metric to measure the success of IVF treatment
CLBR stands for Cumulative Live Birth Rate. It essentially measures the total chance of having at least one live born baby following multiple consecutive treatment cycles. CLBR is usually represented in percentages and for each egg retrieval. An egg retrieval, followed by IVF and formation of the embryo leads to a fresh transfer followed by a number of frozen transfers. So, in this case the CLBR represents the chances of live birth for every 100 egg retrievals, which would have led to many more embryo transfers. CLBR can also be represented by transfers, which gives the chances of live birth for each embryo transfer.
What is CLBR?
Why do we need it?
With IVF treatment becoming more common and accessible, a robust metric that can measures the success of these procedures is necessary for users to make the best market choice. It also helps the treatment centres to advertise their success. And more importantly it is key for policy makers to decide if using public money in this procedure is worth it. The policy maker level decision making is what I am most interested in.
IVF treatment, more often than not, involves multiple treatment cycles before a successful pregnancy. In Sweden, between 2021 and 2023, the success of delivery after the first embryo transfer was just above 25% in general and just above 35% among women below 30 years, who have the best chances of getting pregnant. In 2023, close to 9000 women started IVF treatment and underwent about 12500 cycles. So that is on average around 1.4 cycles per woman during the year. This low treatment rate is however, due to the governments capping on public funded IVF treatments to 3 per person.
How is it calculated?
CLBR is traditionally calculated in 2 ways: Conservative and optimistic method.
These methods differ on the assumption on dropouts’. The conservative method considers that the drop outs have no chance of having a live birth while the optimistic method considers that the drop outs have the same chance of having a live birth as the rest of those who continue the treatment.
The optimistic method works like how survival analysis treats dropouts using the Kaplan Mier method. The conservative method is widely considered more suitable for IVF. However, in a country like Sweden where people are only entitled for 3 cycles of publicly funded treatment, I think the optimistic method is more suitable.
Lets see this with an example.
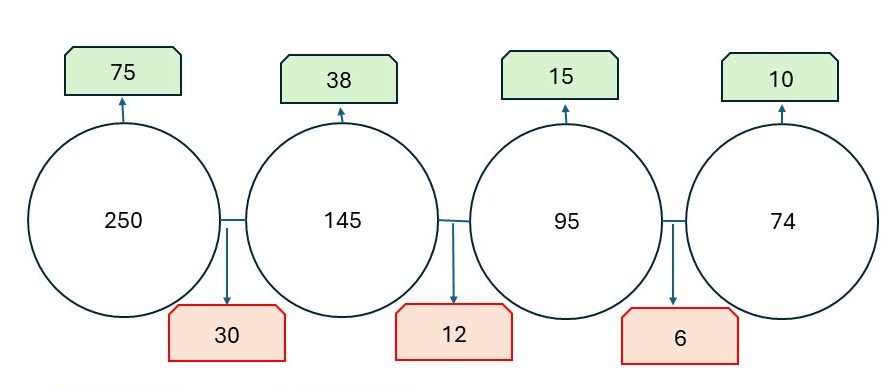
Live births in cycle 1= 75
Live birth rate in cycle 1= 75/250=30%
Total live births in all cycles=75
Dropouts prior to cycle 1= 0
Theoretical live births by dropouts= 0
Theoretical non-delivered women among dropouts= 0
CLBR=
Total Live births in all cycles+Theorotical live births by dropouts/Total women in treatment pool
= (75+0)/250*100
= 30%
Optimistic
30%
Cycle 1
Conservative
30%
Live births in cycle 1= 75
Live birth rate in cycle 1= 75/250=30%
Total live births in all cycles=75
CLBR=
Total Live births in all cycles/Total women in treatment pool
= (75/250)*100
= 30%
Live births
Women in treatment
pool
Dropouts
Live births in cycle 2= 38
Live birth rate in cycle 2= 38/145=26.2%
Dropouts prior to cycle 2= 30
Theoretical live births by dropouts= 26.2% of 30 = 7.86
Remaining dropouts= 30-7.86= 22.14
Theorotical total live births in all cycles
= Total live births in all cycles+ Therotical live births
=75+38+7.86
=120.86
CLBR=
Theorotical total live births in all cycles/Total women in treatment pool
= 120.86/250*100
= 48.2%
Optimistic
48.2%
Cycle 2
Conservative
45.2%
Live births in cycle 2= 38
Live birth rate in cycle 2= 38/145=26.2%
Total live births in all cycles=75+38
=113
CLBR=
Total Live births in all cycles/Total women in treatment pool
= (113/250)*100
= 45.2%
Live births in cycle 3= 15
Live birth rate in cycle 3
= 15/95=15.8%
Dropouts prior to cycle 3=
Actual dropouts prior to cycle 3+
Theorotical dropouts prior to cycle 3 =12+22.14 = 34.14
Theoretical live births by dropouts
= 15.8% of 34.14= 5.39
Theoretical non-delivered women among dropouts= 34.14-5.39= 28.75
Total live births in all cycles=120.86+15+5.39
=141.25
CLBR=
Total Live births in all cycles/Total women in treatment pool
= 141.25/250*100
= 56.5%
Optimistic
56.5%
Cycle 3
Conservative
51.2%
Live births in cycle 3= 15
Live birth rate in cycle 3
= 15/95=15.8%
Total live births in all cycles=113+15
=128
CLBR=
Total Live births in all cycles/Total women in treatment pool
= (128/250)*100
= 51.2%
Live births in cycle 4= 10
Live birth rate in cycle 4
= 10/74=13.5%
Dropouts prior to cycle 3= 6+28.75
=34.75
Theoretical live births by dropouts
= 13.5% of 34.75= 4.70
Theoretical non-delivered women among dropouts= 34.75-4.70= 30.05
Total live births in all cycles=141.25+10+4.70
=155.95
CLBR=
Total Live births in all cycles/Total women in treatment pool
= 155.95/250*100
= 62.4%
Optimistic
62.4%
Cycle 4
Conservative
55.2%
Live births in cycle 4= 10
Live birth rate in cycle 4= 10/74=13.5%
Total live births in all cycles=128+10
=138
CLBR=
Total Live births in all cycles/Total women in treatment pool
= (138/250)*100
= 55.2%
14 August, 2026
See if you agree with this:
Conservative CLBR
- Conservative CLBR at cycle k= (∑Actual Births until cycle k)/(Number of patients in cycle 1)
Optimistic CLBR
- Optimistic CLBR at cycle k= (∑Actual Births until cycle k+∑Theorotical Births by dropouts until cycle k)/(Number of patients in cycle 1)
- Theorotical Births by dropouts until cycle k= Dropout pool until cycle k * Success rate at cycle k
- Success rate at cycle k= Actual births at cycle k/Number of patients at cycle k
- Dropout pool at cycle k= Dropout pool at cycle (k-1)-Theorotical Births by dropouts until cycle k+Dropouts prior to cycle k